Traffic Surveys - Yarger Engineering, Inc. 317-475-1100 Email Us
What is a Traffic Survey or Traffic Data Collection?
A traffic survey can include many types of traffic data collection:
- Traffic Counts (Traffic Volume Counts)
- Speed data collection
- Trip generation data collection
- Origin - destination data collection
Hose Counts
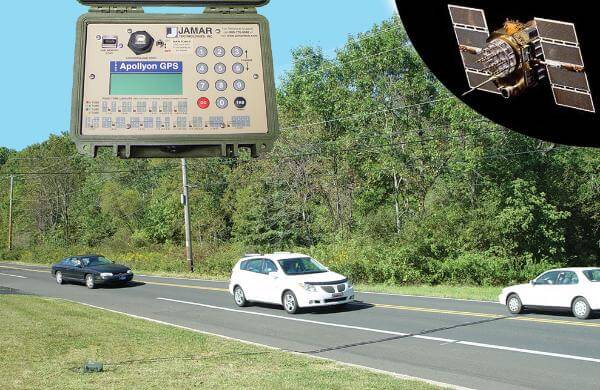 Hose counts are basically the rubber hoses you see while driving down the road. The hoses are connected to a box on the side of the road that interprets air pulses from hoses as they are run over. The one shown on the left is a Jamar Apollyon with GPS capabilities. They are battery powered and some have solar panels to extend their capabilities and reduce charging time between counts. Not only do they count the vehicles, but also can classify the vehicle into types (car, pickup, motorcycle, heavy truck and semi), and collect speed data. They have some limitations since they only know that the hose was run over at a particular time. Their locations are limited since they need vehicles all going in parallel directions and crossing the hoses at a perpendicular angle. They also require vehicles going at constant speeds. The hoses can break or be cut intentionally. Maybe the most important problem is that they are unaware of their surroundings so they can't explain why some data may not be as expected. An example would be a very low volume road having a very high peak for a few minutes while a funeral procession past by. They have the advantage of being a cheap way to collect data for an extended period, such as 48 or 72 hours, or even a full week for basically the same amount of effort. The data can be collected in selected time periods, or each vehicle can be time stamped and then the data reduced to time periods later. Typical time periods are hourly, 15 minute and five minute periods.
Turning Movement Counts - Bike and Pedestrian Counts
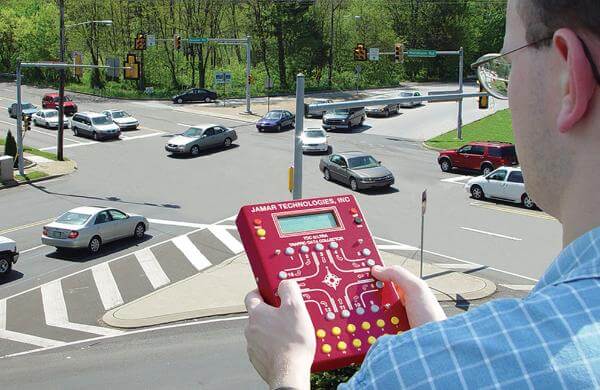 Turning movement counts are just what the words say, counts of turning vehicles, athough through traffic is also counted. They can also include pedestrians and bicycles. At a typical four leg intersection there are twelve turning movements for vehicles, left through and right from each approach. Vehicles are often classified, but not finely as with a hose count. Typically it is just cars, heavy vehicles, pedestrians and bikes. Heavy vehicles typically include any vehicle with more than four tires, such as semi or even a car pulling a trailer. Motorcycles are typically counted as cars since they tend to act the same way in traffic. Bikes may be counted as cars in the street or pedestrians on the sidewalks. Occasionally other vehicles are classified separately such as buses or horse and buggies, but only when they are expected to make up a significant portion of the traffic. Otherwise they are included as heavy vehicles or cars.
There are several ways of performing a turning movement count. Most involve humans watching the traffic and using a count board. A count board looks like an overgrown calculator with keys for various turning movements, and bank keys to classify the vehicle types. The one on the right is a Jarmar Ultra. The bank key is like the shift key on a keyboard where it records the same information, but just a little differently so that a car that turned right is the default, but a bank or shift right would be a heavy vehicle. Some times there is a small screen on the count board and other times the count board attaches to a computer.
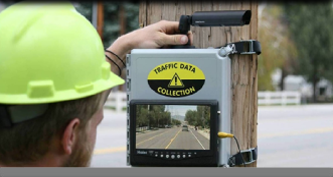 Video cameras are sometimes used to collect videos that can be watched back in the office for turning movement counts. The one shown on the left is an L2 Data Travel Monitor. Yarger Engineering also uses COUNTcams from Counting Cars. Cameras have the advantage of being able to economically sit at the intersection and record traffic for reduction in the office. They also provide a record in case there are questions later. They have the disadvantage of a limited field of view. When a person counts the turning movements at the intersection, they can turn their head to see things that may be out of view for the camera. The cameras often don't record sound, while a person can hear things that might cause them to turn their head. An advantage that cameras have is that the recordings can be played at several speeds to speed up low volume counts, or slow down high volume counts. Another big advantage of cameras is that they don't require breaks and don't turn away.
Cameras also provide a record in case there are questions later. Yarger Engineering used a camera for one count where there was concern that something was wrong, but we couldn't spot it immediately. After reducing the video to turning movement counts, we had a feeling something just wasn't quite right. We finally noticed that there were no school buses, but there were three schools on the two roads within two miles! If we had counted with a human at the intersection, there wouldn't have been easy way to figure this out.
Some people use machine vision where they send their videos off to be processed by a computer. They can give accurate counts under ideal conditions and can be cost effective, but we have found too many problems with them when the video isn't watched by a human being, such as queue spillback creating a situation where there is more traffic demand than capacity for vehicles to enter the intesection, so the count is low without notifying the end user. A human can see that there is a problem, but the machine just counts traffic as it goes in and out of view. Another issue is spotting unusual vehicle types. We had a count where there were a large number of forklifts using the road, but machine vision needs to be set up ahead of time to identify the unusual vehicle type. While it was forklifts this time, it could be horses next time, or a very high bicycle usage where they are normally low volumes and counted as cars in the road, or pedestrians on the sidewalks.
Finally, some traffic signals use detectors to calculate green time in real time. These detectors can sometimes be used to collect traffic data.
Speed Data Collection
There are several ways to collect speed data. Yarger Engineering uses the hose counters as mentioned above. There are also radar guns and microwave detectors.
Trip Generation Data Collection
Trip generation data collection encompass two types of data collection, traffic counts and interview data. Depending on the location, either hose counts or turning movement counts may be appropriate. Interviews involve asking drivers three basic questions:
- Was the primary reason they got in the car to come to this location?
- If not, would they have driven by this location's driveway?
- If not, how far out of their way did they drive to get to this location?
Origin - Destination
Origin - destination data basically tracks where a vehicle came from and where it went. These can be used in larger studies like on freeways to analyze weaving between ramps, or in neighborhood traffic calming studies to see if vehicles are cutting through a neighborhood or making stops in the neighborhood, such as people that live there or visiting. Most collect license plate data at various locations and then match them with allowed travel time.
What Does a Traffic Survey Cost?
 The answer is that it depends on the type and quantities. A simple hose count typically runs about $200, but depends on the travel involved. Of course, multiple counters can be put out at one time, so that can drop the cost per count. Turning movement counts run about $400 per four hour count, and around $1,000 per 12 hour count. Using video can reduce the cost for multiple counts and at low or high volume intersections for longer count periods. It can be good to count traffic on more than one day to get average counts rather than a single day, which may not be typical. When Yarger Engineering does a speed studies they are part of a hose count and don't add to the cost. Trip generation studies depend on the hose or turning movement counts plus the cost of the interviews. The counts should be at least two days and preferable three or four. Fridays are not typically studied. Saturday and Sunday are occasionally studied for land uses that peak on the weekend such as retail and religious organizations. The interview cost will be dependent on the number people involved and the time they take. Yarger Engineering's rate for this would be $60 per hour per person including travel time. There would be also an engineer involved at $120 per hour to manage the interviews and reduce the data. Origin - destination studies can run a wide range and depend on a lot of details. Give us a call at 317-475-1100 or email us to discuss.
How Long Does a Traffic Survey Take?
Like the cost, it is a function of the inputs, but typically two to four days per intersection for straight forward counts. In one case a couple of years ago we had to wait a couple of months for nearby road construction to be completed, and then a couple more weeks for the local schools to return from a fall break. Of course, weather and holidays can also delay collecting traffic data. Trip generation and origin destination data collection is highly dependent on the details, so give us a call at 317-475-1100 or email us to discuss.
Next Step
Once the traffic study is complete, the next step is to turn the study recommendations into construction plans and get permits. Yarger Engineering, Inc. prepares road, signal, signage and marking plans for submittal to governmental agencies for permits.
Yarger Engineering offers free initial consultations and proposals, and we would be glad to discuss your situation. Call us at 317-475-1100 or email us about your traffic survey or data collection today!
